Redrawing the World
School: Evergreen Community Charter School
City/State: Asheville, NC
Grade(s): 7
Format(s): Poster: Informational
Subject(s): Mathematics
Project Overview
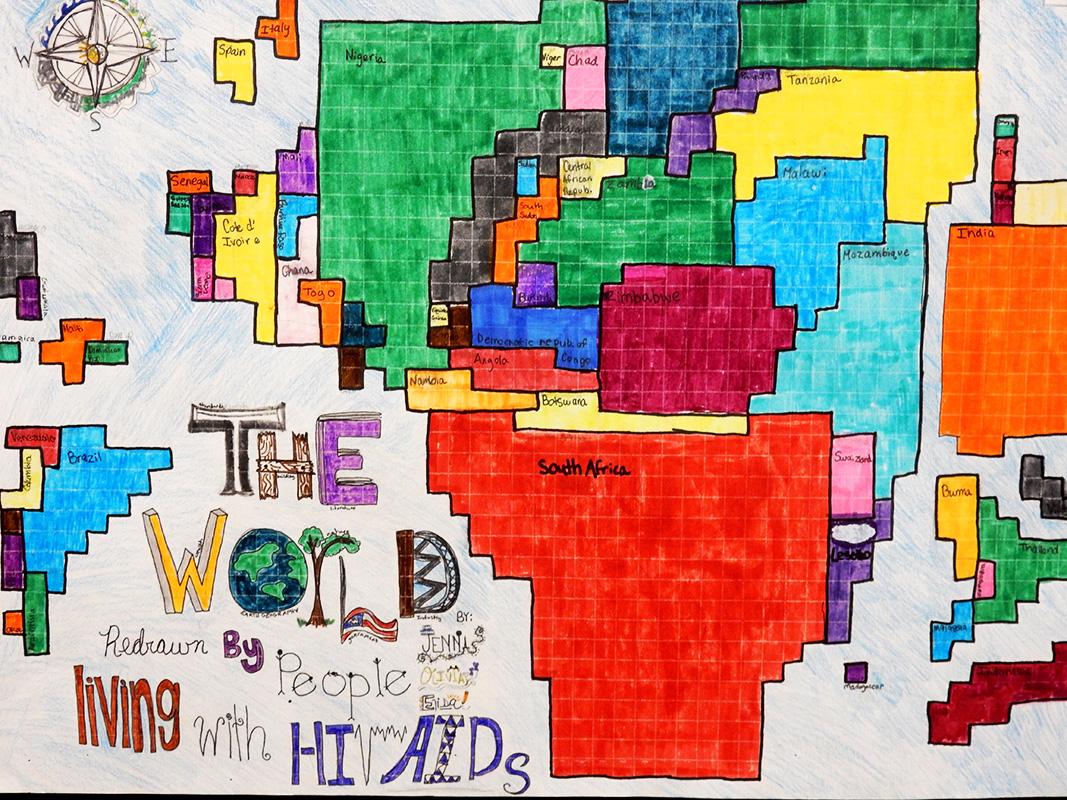
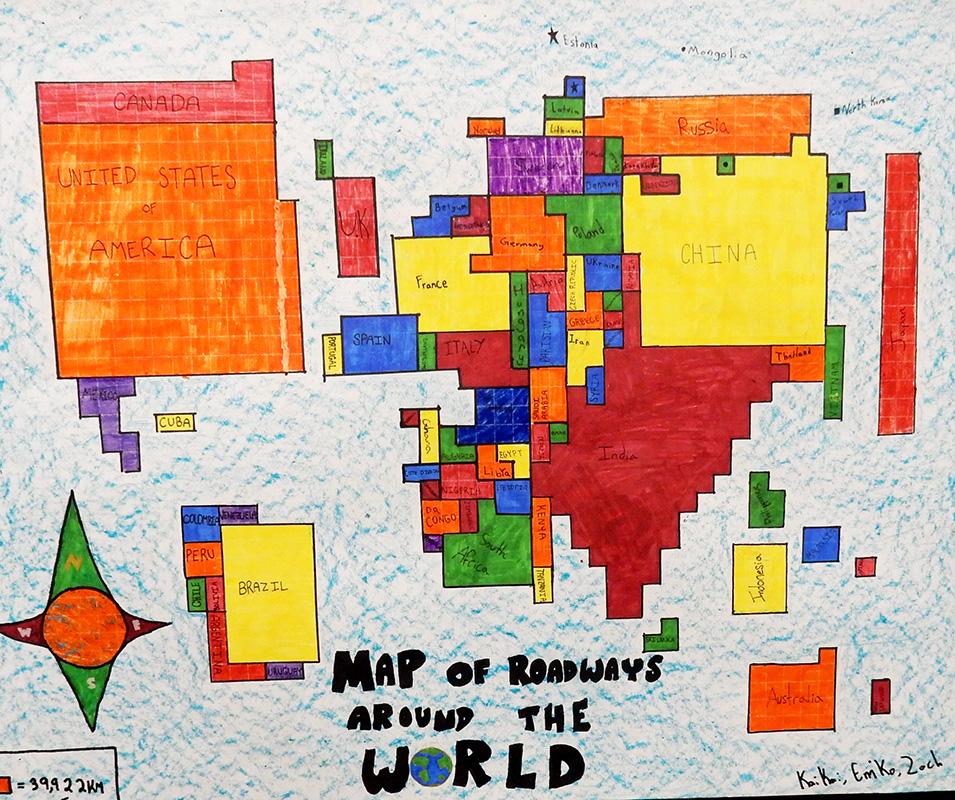
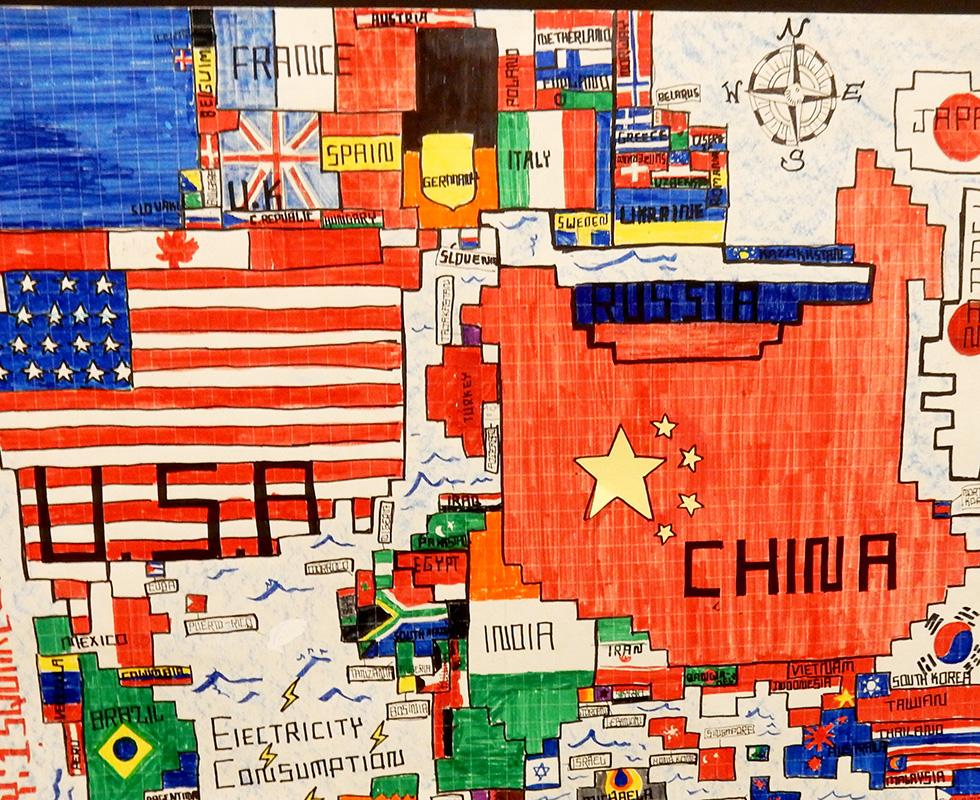
This project was part of an interdisciplinary expedition entitled Global Citizenship. As part of this study in math, students were asked to create a scale drawing using a statistic other than land mass or population in order to visualize how countries in the world supported the statistic. Examples of the statistics students chose from included electricity usage, natural gas exports, number of airports, and HIV/AIDS deaths.
Students were put into groups of 3-4 members and chose world statistics based on interest from a generated list. They visited the CIA factbook site and searched for their statistic category. They were asked to copy the data for the first 100 countries listed and determine the sum. Students then needed to figure out the scale and how many squares on poster board each country would get on the map.
They created their redrawn world map based on this information and interpreted the results.
How This Project Can Be Useful
- Excellent example of how mathematics can be integrated into an expedition in a meaningful way
- Illustrates a compelling way of making math come alive
- Integrates math and visual art


