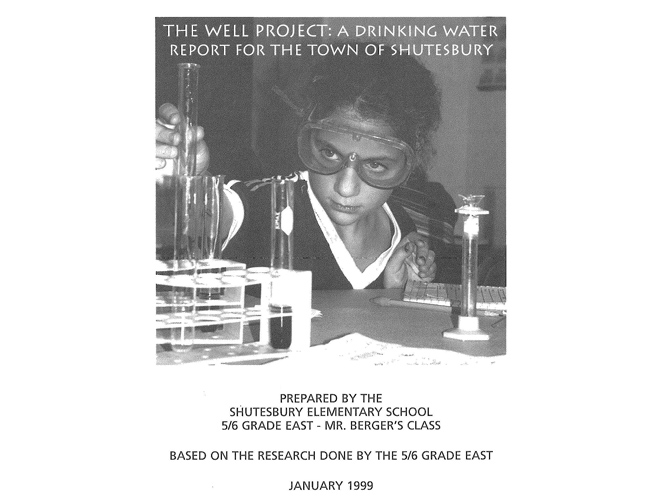

The Well Project: A Drinking Water Report
School: Shutesbury Elementary School
City/State: Shutesbury, MA
Grade(s): 5, 6
Format(s): Report: Science
Subject(s): Mathematics, Science and Technology, Social Studies
Project Overview
In the winter of 1999, 5th and 6th grade students from the Shutesbury Elementary School, in Shutesbury, Massachusetts prepared this report on the quality of well water within the town as part of a year-long Learning expedition on water resources. The full expedition addressed state standards across a range of disciplines, including a study of ancient civilizations (using the lens of water resources); a study of the physics and chemistry of water and the geology of water resources; ecology and pollution; and a study of classic literature set in water environments. The service learning elements of the expedition involved students in running two research projects – testing the quality of surface water in town, and the quality of drinking water in town.
This project closely followed a project on the quality of surface water within the town (entry #270). Students built on the skills they developed in that earlier project and extended them to new questions and to more sophisticated types of measurement and analysis.
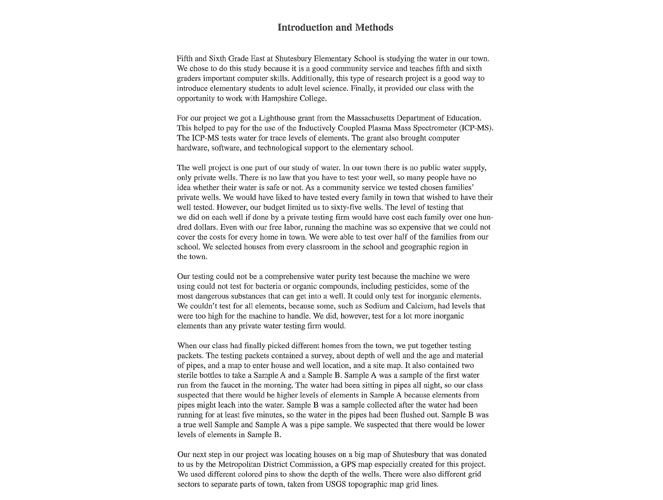
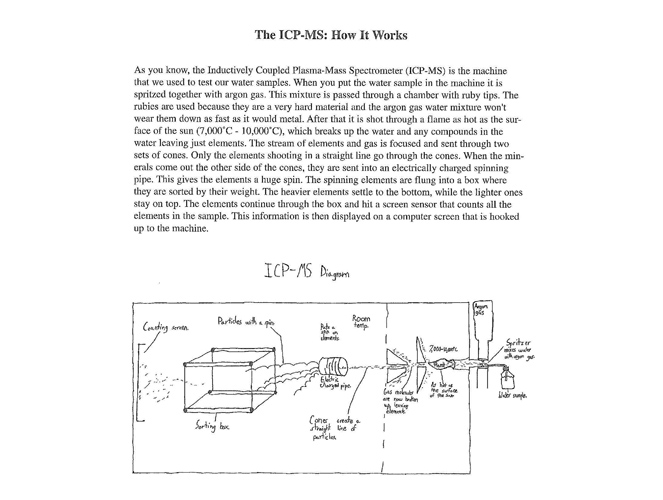
In the town of Shutesbury there is no public water supply – all homes rely on well water, as well as public buildings and the school. Most residents are unaware of the safety and quality of the water they are drinking. As a means of analyzing the quality of this well water, water was collected by 65 homeowners who signed up for this free service, and then analyzed by students using an Inductively Coupled Plasma Mass Spectrometer (ICP-MS), housed at Hampshire College. Elementary students commuted to the college, in research teams (transportation provided by parents and college students) to work in the college lab, supervised by a student teacher and by college students and professors.
Students kept track of their results on a wall-size GIS map of the town, and entered all data into Excel spreadsheets. All students became proficient users of the Excel software program.
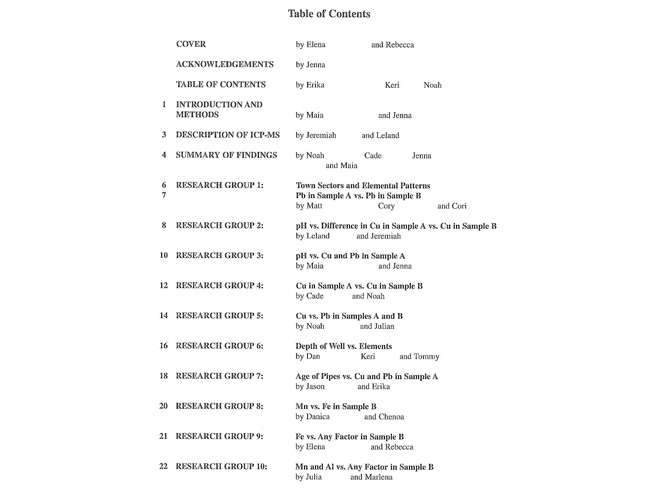
Students did two levels of reporting: 1. A confidential report was prepared for each individual house and 2. An overall summary report was prepared for the town. The product here is the report given to the town. Students surveyed every home involved in the study to collect surrounding data that might correlate with elements in the water (e.g. depth of well, site of well in regards to road and septic system; age of well; age of water pipes). After individual reports were delivered to families, students worked in teams to make sense of the broader town data, looking for correlations of what was getting into the water in what sectors of town.
Because the news was not always positive, students had real emotional responses to the conclusions they drew about the data they collected – they felt the power and realness of the data. Students also learned the importance of keeping data confidential. As the project managed to a great extent by students, they also worked in teams to manage relationships with town officials, the media, and to address legal and real estate issues.
The work was funded in part through a Lighthouse Grant they received from the Massachusetts Department of Education, which helped pay for the use of the scientific equipment. The project was documented by the Harvard Center of Astrophysics Video Team for inclusion in an Annenberg Foundation video documenting exemplary science practices
The students received an award from the state for their environmental research.
How This Project Can Be Useful
- Exemplifies students engaging in adult-level research that has an important and real purpose
- A good model of a scientific report written and produced entirely by young students – language and data are simple but accurate
- Compelling example of service learning – a vital contribution that also entailed serious learning
- Demonstrates the capacity of elementary students to accomplish professional quality research and manage political relationships
- Demonstrates the power of real responsibility given to students
- Highlights community partnership with local college, giving students the opportunity to become familiar with college-type experiences
- Powerful authentic audience – residents of the town
- Highlights a product that does more than just report data – students provide clear and accurate descriptions of why they collected the data and what they found
- The student-written introduction orients the reader to the scope of the project
- Provides a means for getting students excited about science and being scientists
Common Core State Standards
| Standard | Long Term Learning Target |
|---|---|
| RI.5.2 |
|
| RI.5.8 |
|
| W.5.2 |
|
| W.5.4 |
|
| W.5.7 |
|
| RI.6.2 |
|
| RI.6.8 |
|
| W.6.2 |
|
| W.6.4 |
|
| W.6.7 |
|
| RST.6-8.2 |
|
| RST.6-8.3 |
|
| RST.6-8.7 |
|
| 5.G.2 |
|
| 6.SP.1 |
|
| 6.SP.5 |
|